-
Client
Hospitality sector, owner of multiple bar & restaurant chains, with over 1700 UK venues
-
Asset
Restaurant / Bar / Pub
-
Result
Reductions in exposure to customer injury and subsequent insurance claims
Client challenge
The client had been noticing an increase in insurance claim pay outs for customer injury across their UK businesses.
To understand where to focus HSE improvement efforts, the HSE Manager has to consider numerous potential influencing factors including venue location, brand, HSE management practices, time, location, venue layout, equipment types, dish types, public versus employee risk exposure and claims ratios.
A vast quantity of data had been collected in HSE reports but the ability to extract detailed insight from it was poor. Deep analysis of trends, locations and procedures for example could only be done on a case by case basis, driven by key events and facts.
How we helped
With LRQA's SafetyScanner solution, we used Artificial Intelligence (AI) and Natural Language Processing (NLP) to quickly and easily turn raw data into meaningful insights, to highlight to the client areas of large HSE risks and recommended strategies to tackle them. We worked with the client to define a set of key questions and then generated the insights they needed.
Insight
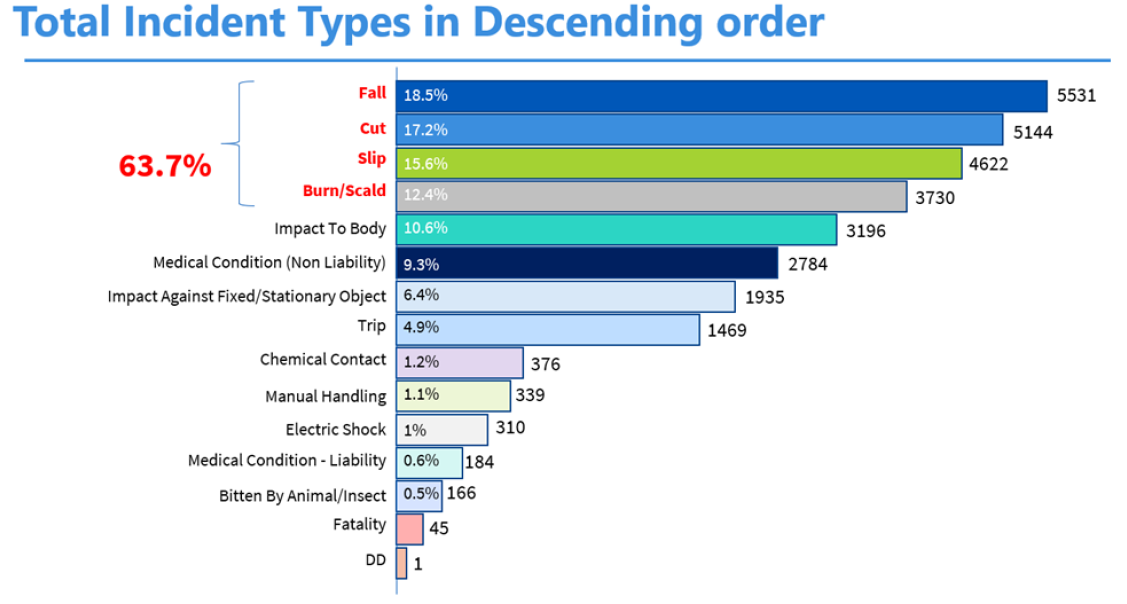
1. Which is the worst offending hazard across my safety landscape?
The SafetyScanner system not only visualised the split between hazard types, it also verified the quality of the data. Four types of categories (fall, cut, slip, ‘burn/scald’) statistically represented 63.7% of all the incidents, highlighting the areas to explore further and proving the ‘80/20’ pareto principle applies to safety challenges also.
2. What are the recurring topics in each hazard?
Using different levels of filtering generated crucial additional insights.
 3. Are there recurring elements across these types of hazards?
SafetyScanner’s unique ability to identify free text elements and ‘connect the dots’ between identical items but different words (i.e. kid, child, children, babies), proved highly valuable. The tool highlighted the most recurring contributors to the highest risks for customers were – ‘Toilets’, ‘kids’, ‘wet floors’, ‘stairs’ and ‘glass’.
This high-quality data turned into unbiased insight - spanning different hazards, at different facilities - giving guidance and direction to HSE management. To identify actionable insight we went a level deeper and worked with the customer to define a new question.

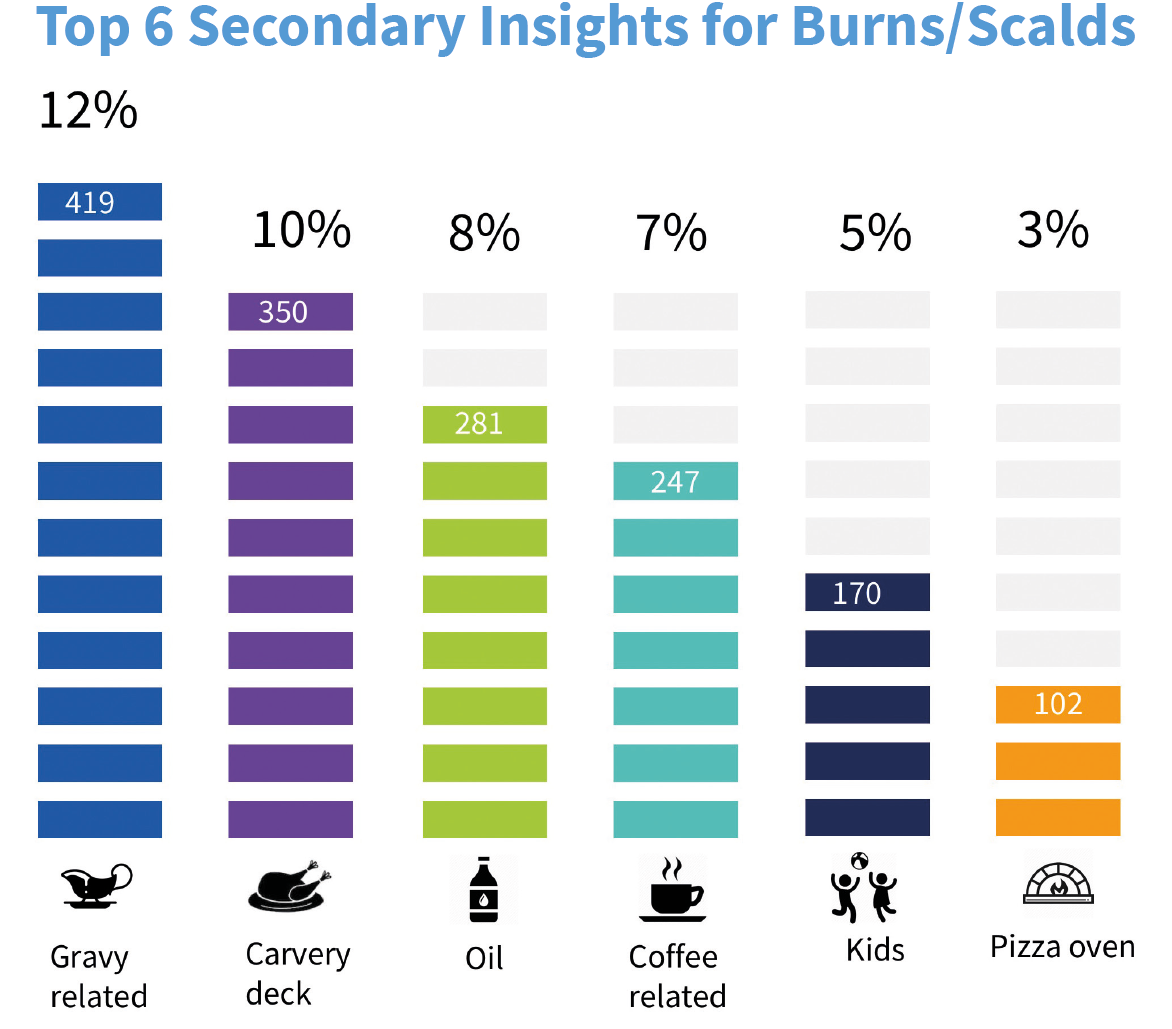
4. What is the worst offending appliance and dish?
SafetyScanner was deployed on data from the brand with the highest claims for customer injury – with transformational findings.
The worst offending dish was Yorkshire pudding which had many different terms associated with it and was not previously easy to identify as a group. Similar insight emerged regarding the worst offending appliance.

The Impact
This information has proven highly valuable. The HSE manager is now empowered to focus on this newly identified risk element and initiative to design new products, training and audits to address areas of concern.
HSE Managers across the entire business can now check all data streaming from the various brands on the same topic, get a clear view of performance over time and quantify improvements – all at the click of a button.
-
Key services and solutions
Key services and solutions
Here are links to some of the services and solutions that came together to deliver the project.